Index
Other categories
13 June 2018
Tableau: dashboard and analytics for ecommerce


Digital has introduced tremendous potential into corporate strategy-making: measurability of actions.
The enormous amount of data generated by ecommerce platforms is extremely useful information for business management.
Without constantly updated information and indicators, (also called KPIs or Key Performance Indicators) it is impossible to know the health of one's e commerce. Data must be used and included within an overall strategic view of one's business, so as to pursue real goals in order to optimize results.
For this reason, it is imperative to aggregate relevant data and build synthetic KPIs that are the thermometer of ecommerce performance and return. In order to run a successful ecommerce, at all times it is necessary to know precisely thesales performance, the marginality of orders, the conversion rate of prospects and a whole series of indicators that are fundamental to improving performance.

Tableau: business intelligence for ecommerce
Every marketing manager's dream is to be able to build his or her customer's customer journey in detail and to be able to offer a custom offer at the right time in the journey.
Often, however, the data comes from different and not really connected sources. Tracking data and aggregating it into a single platform can be an expensive endeavor and the results are not always as desired.
That is why in Rewix the most sophisticated and advanced business intelligence tools are integrated to enable store managers and marketing managers to have all the critical information they need to assess their e commerce sales performance at any given moment.
Rewix integrates two data analysis tools:
- Integratedreporting engine
- Embeddedtableau
The Reporting engine is a business intelligence tool for analyzing CRM andecommerce data by enabling the extraction of useful information to increase sales and customer loyalty. Functions include collecting, monitoring,analyzing and reporting on all data saved on the Rewix database. Reports can be created based on specific customer requests and can merge multiple data sources.
They are available in various formats e.g. PDF, Excel, CSV, XML and contain mission critical information updated in real time or on a scheduled basis. Access to data and reports is filtered by permissions for users and roles.
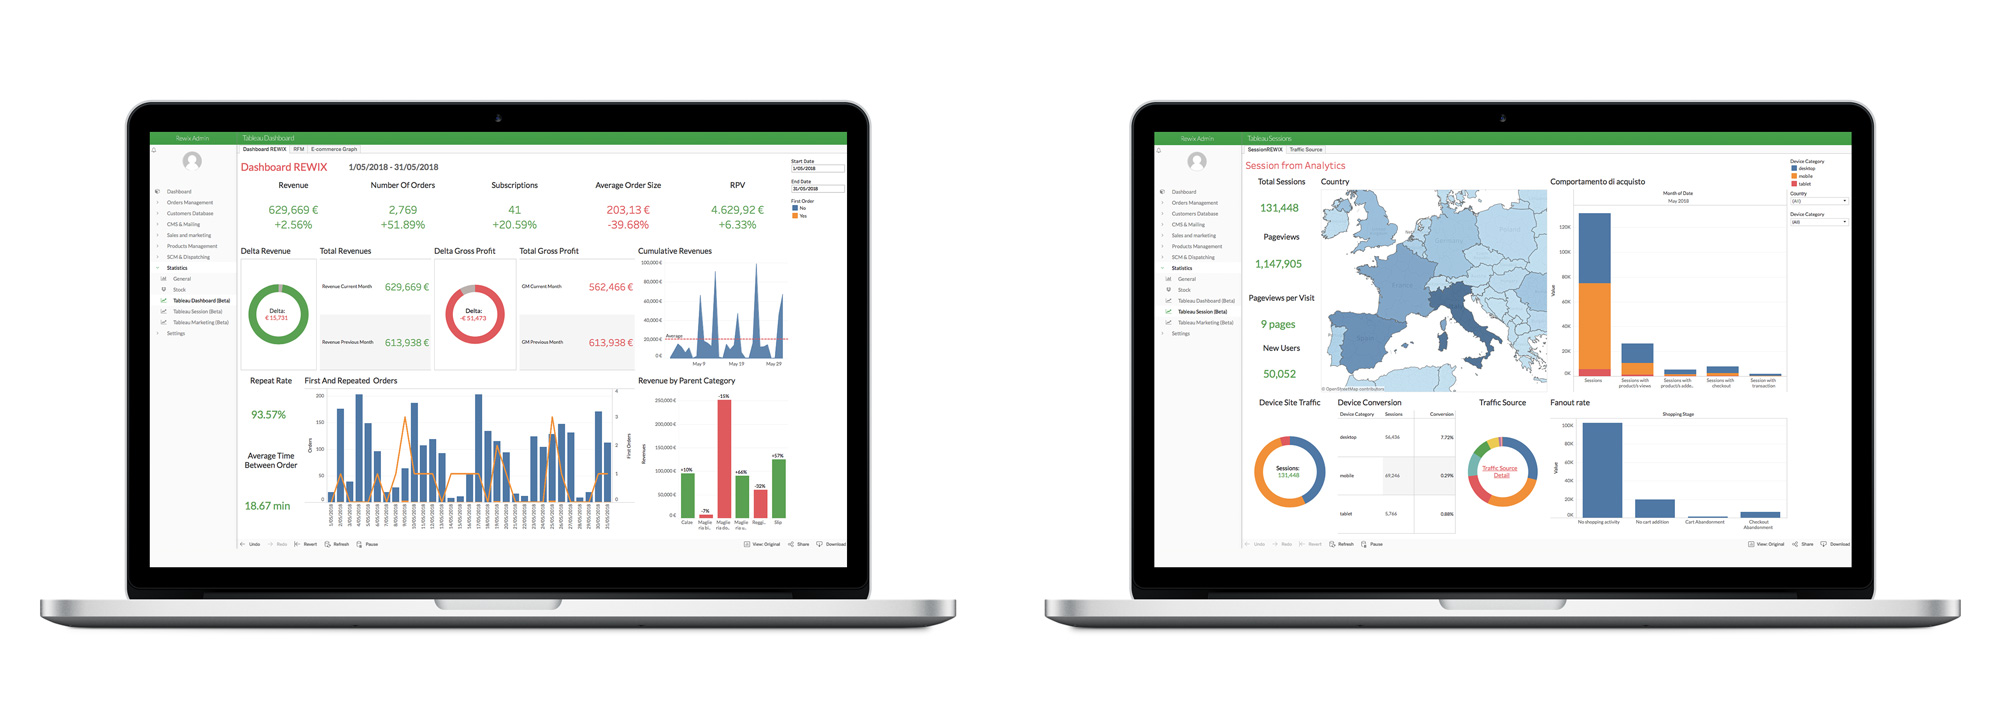
To meet the needs of autonomous data tracking, visualization and analysis by marketing managers, the following was born Tableau embedded for Rewix, the data driven marketing solution optimized forecommerce.
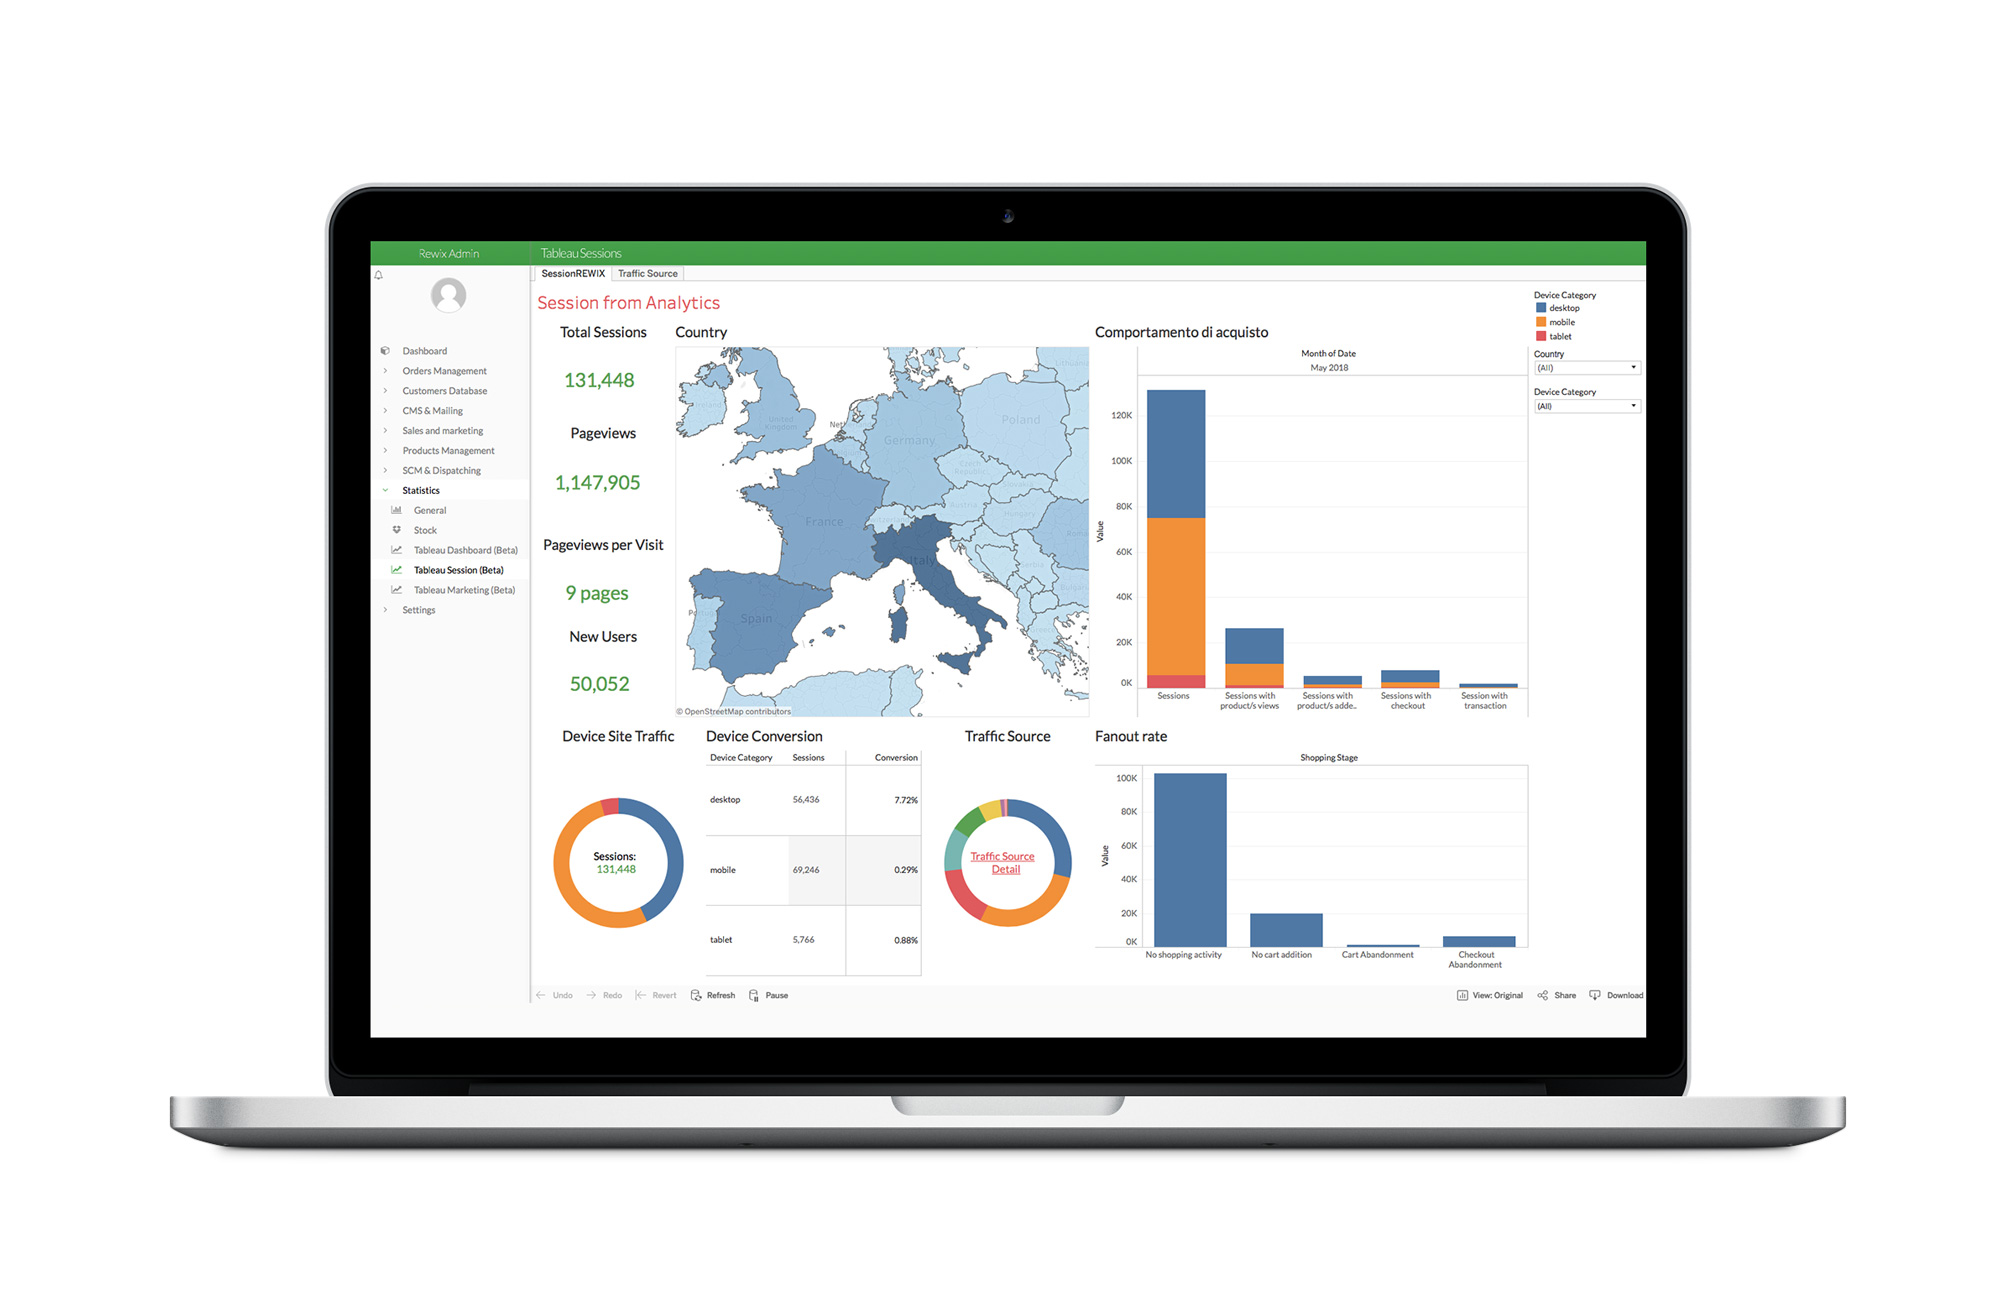
Tableau embedded helps transform data into insights that can create a decisive impact on business KPIs and make the right decision with all available information. Tableau is a business analysis and data intelligence tool optimized for data-driven businesses that allows you to view strategic information anywhere, anytime to always have a complete view of your KPIs.
Tableau offers the most advanced business intelligence capabilities. It not only allows you to create engaging dashboards and effective data representations, but also to visualize strategic data (encapsulated in multiple data sources) in an interactive, simple, and intuitive way, processed with statistical computing tools for trend, regression, and correlation analysis.
With integration into Rewix, it can easily connect to data stored by Rewix, from the CRM, from DEM, and from Google Analytics to provide detailed and accurate analysis of trends in key KPIs.
Tableau is a continuously evolving software. For the 5th consecutive year Tableau has been identified by Gartner, one of the world's most authoritative independent information sources in the Information technology, Marketing and Supply Chain industries, as the leading solution in the market.


